
ADWISE RoadMap – User Guide
Basic info v2.5
Data Structure and Data Types |
Visual Elements |
|
|
|
 |
 |
|
|
|
All Data & Time & Labels |
Zoom & Progress & Sorting |
|
|
|
 |
 |
Tutorial video (v1.5.0)
Help (v1.0.0)
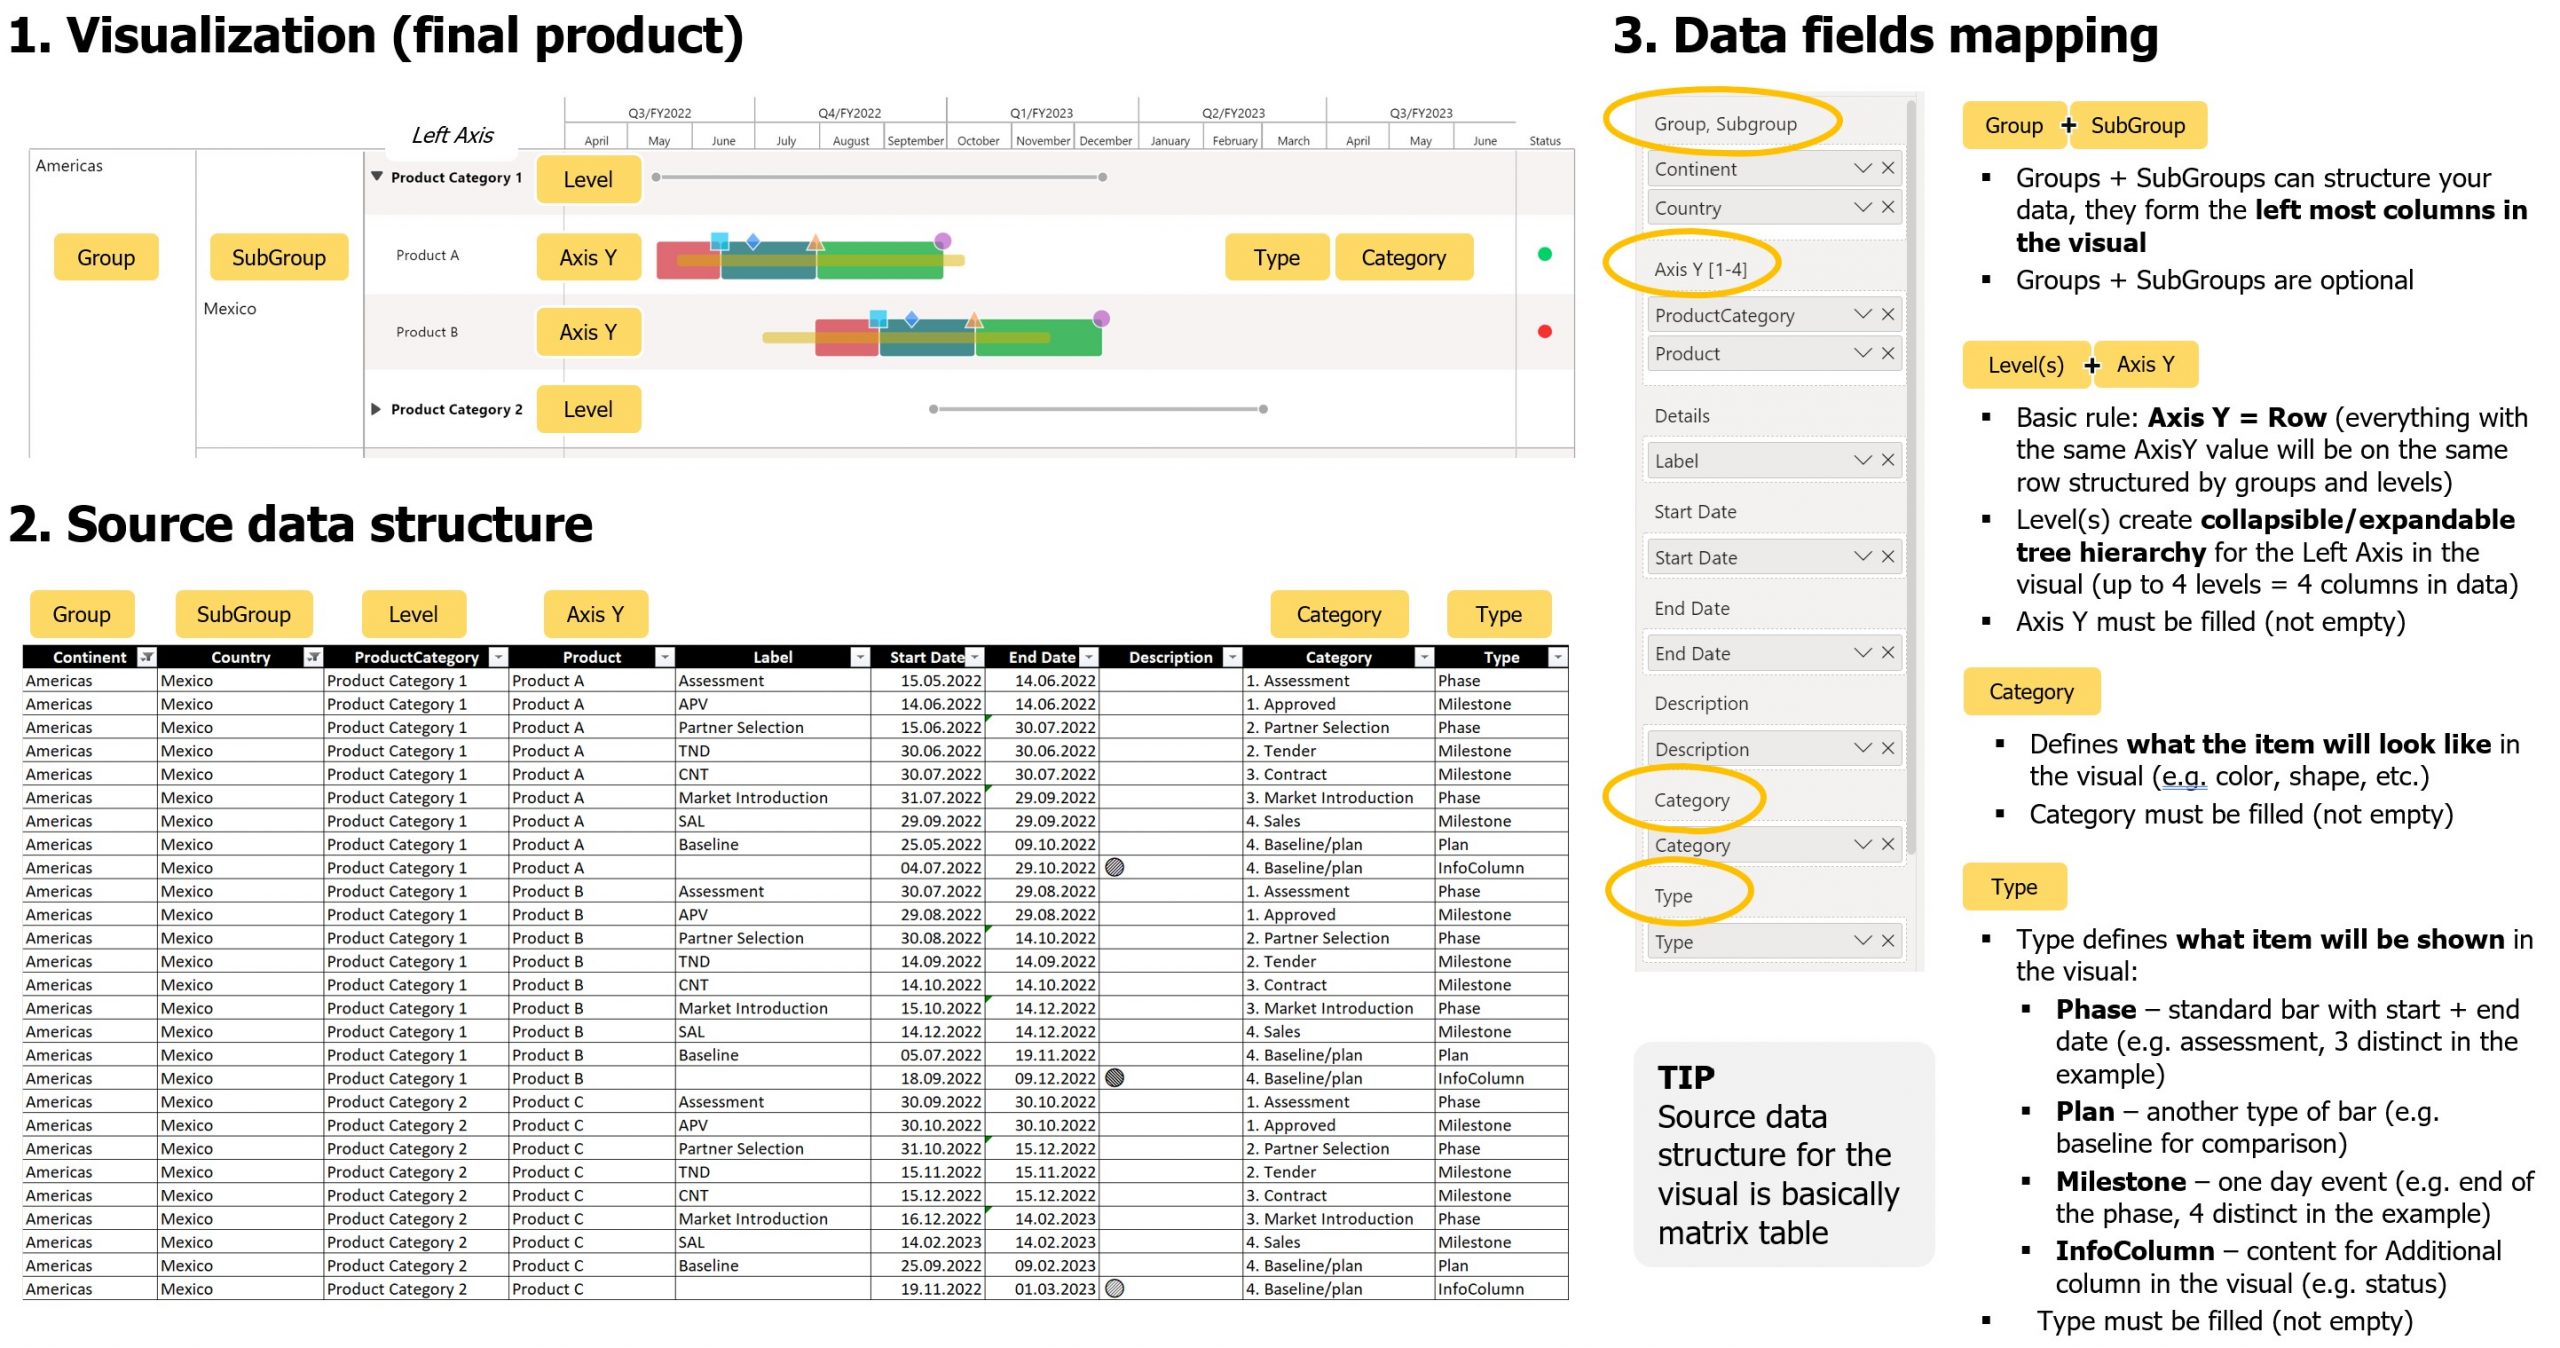
Adwise RoadMap is a visual component for Microsoft Power BI. It is designed to present overview of the time plans – namely the plan phases and key milestones of these phases. This visual is NOT scrollable. All of the currently filtered data will be shown in the visual (in 100% of its height and width)
Mapping the data
To speed up understanding of functionality and data mapping in our visual, you can use these demo files: .pbix file with sample roadmap and .xlsx file with dataset.
Following table & scheme explain how to pair your source data to the fields of the visual.
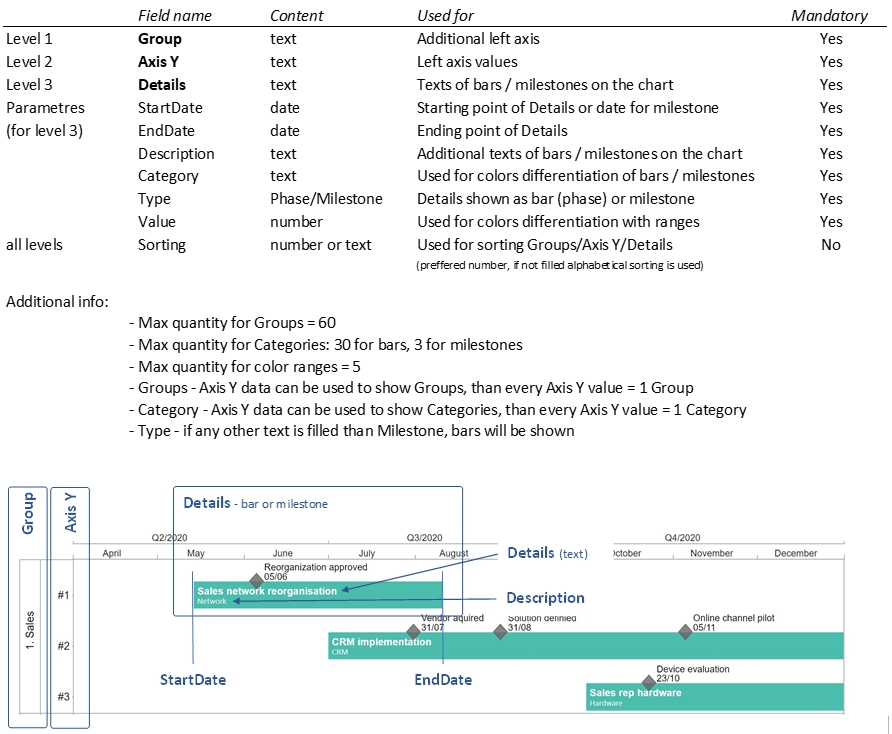
To properly set up the connection, map each visual’s mandatory field with one of your data columns with respective meaning. The meaning is depicted in the scheme below the table. Should your source data not contain all the required fields for the visual, see “additional info” below the table. Some of the data fields can be used more than once. Make sure that the format of your source data matches format required by the visual (see the “content” column of the table).
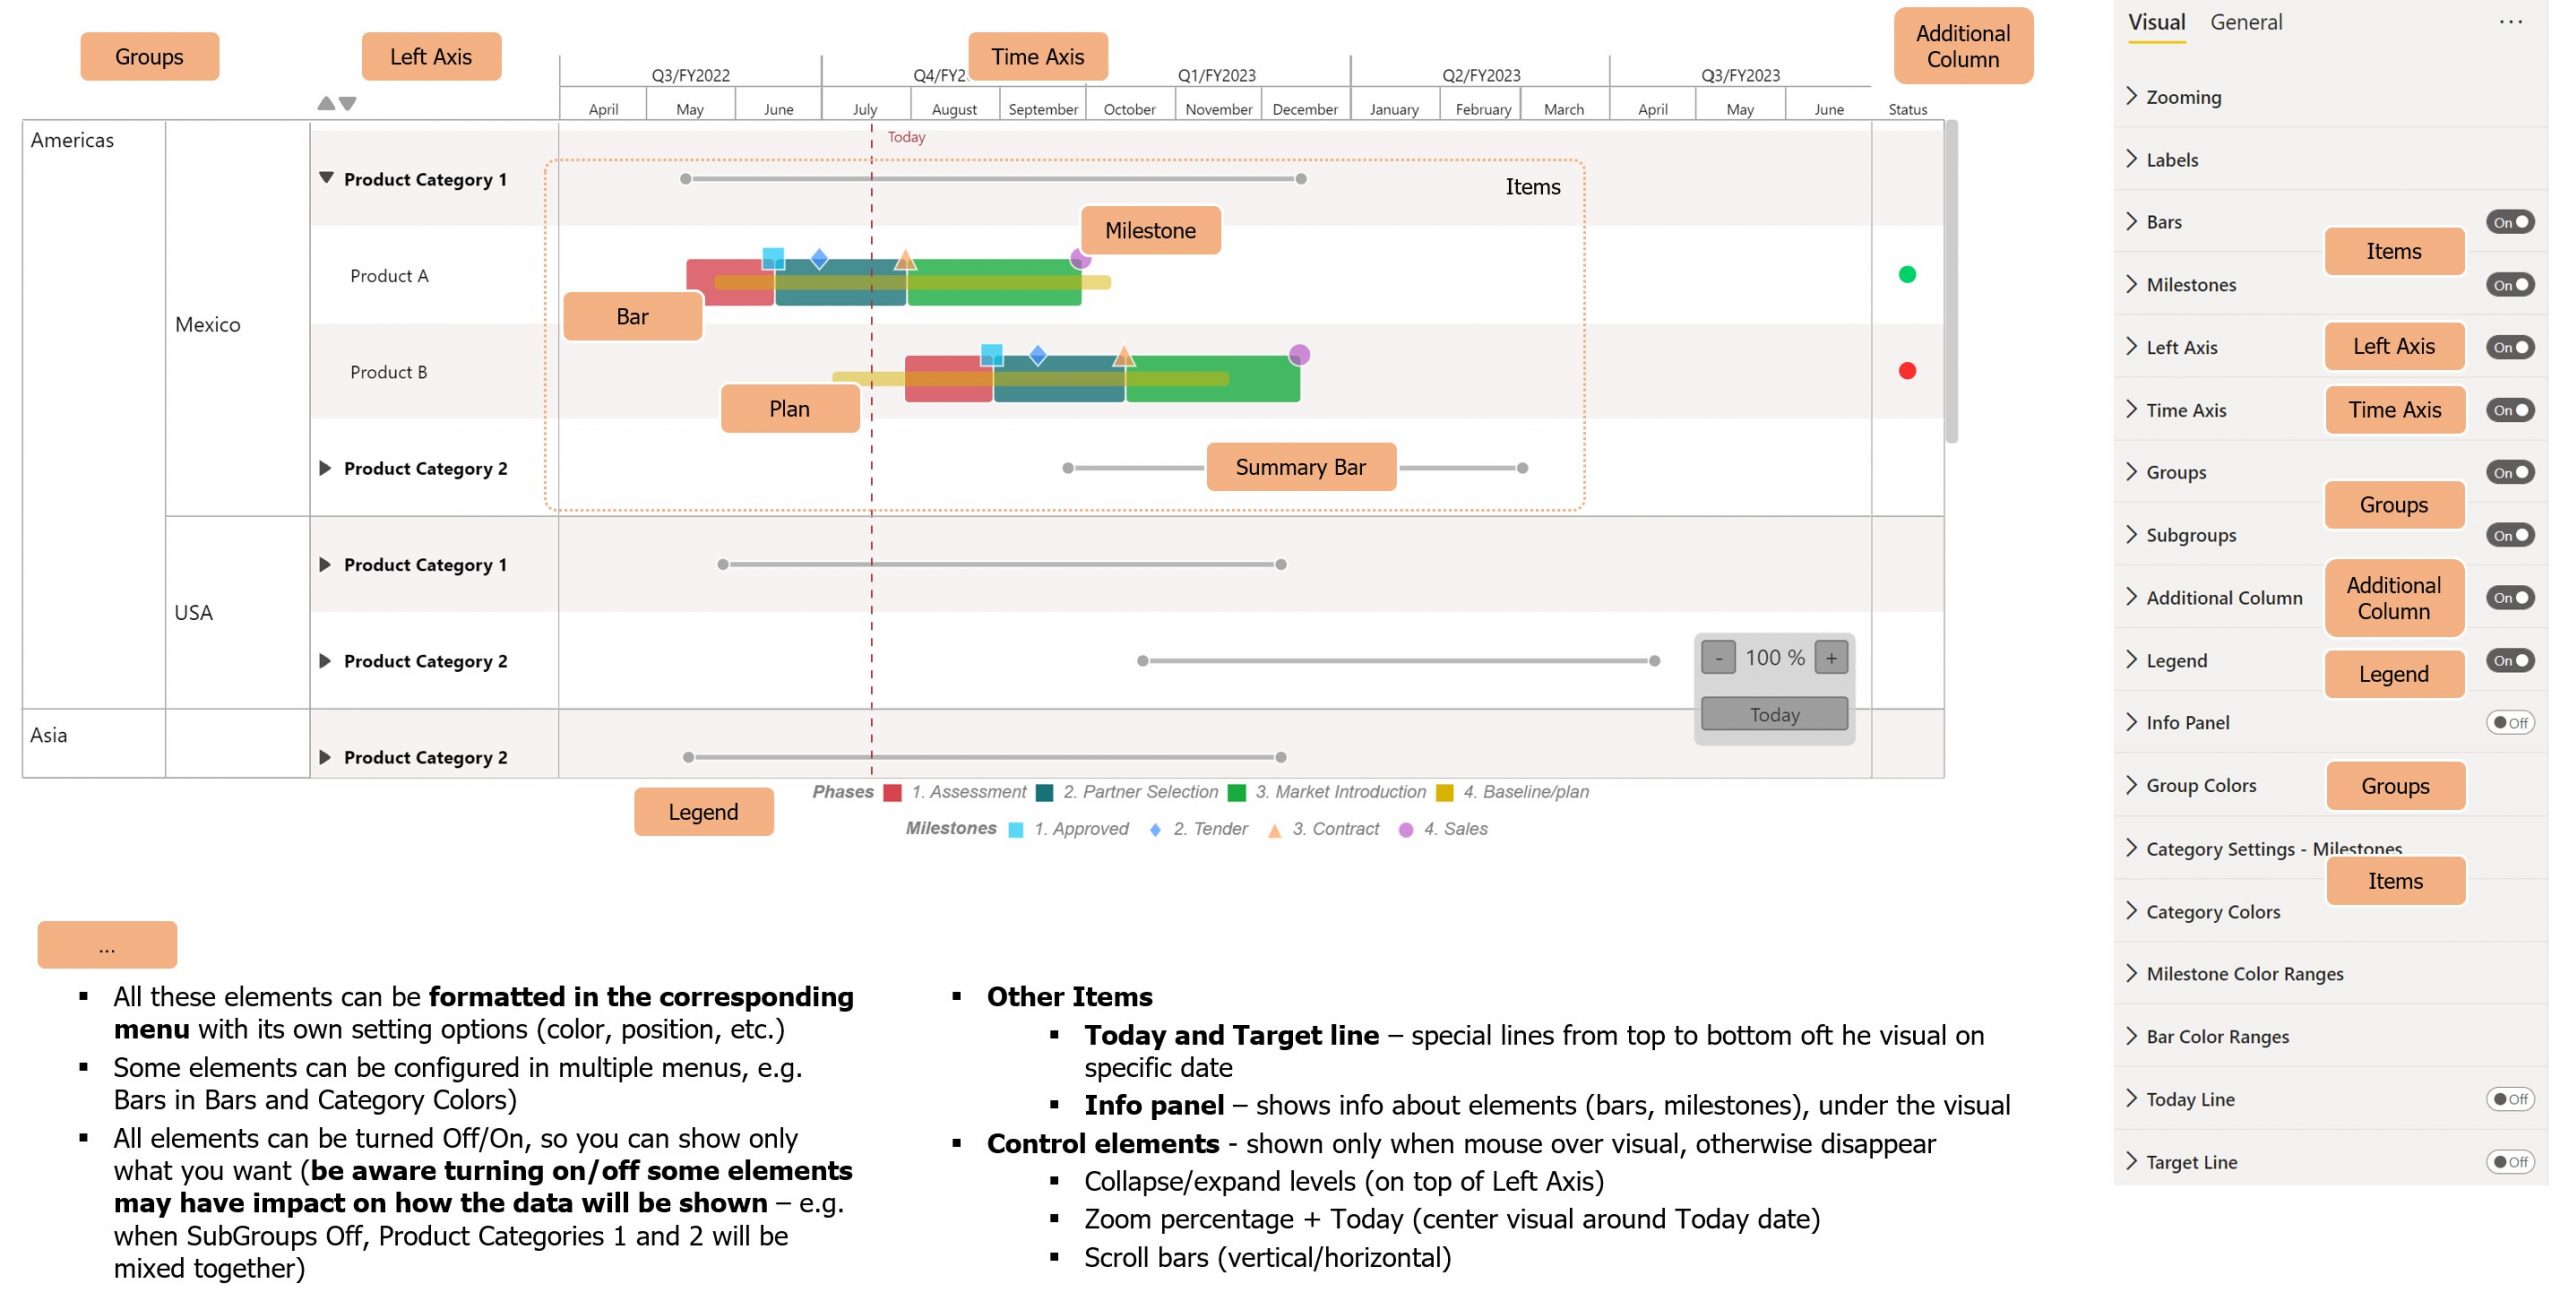
Formatting options
Bars
You can specify bars in the field “Details” and field “Type” = Phase (or any other text than milestone). Basic formatting options for bars or phases in RoadMap:
Show On/Off – showing bars
Space (% of full height) – spacing between bars (when Milestones shown: 0 means no spacing, 50 height of bars same as spacing, 100 = no bars at all; when Milestones off: 0 means no spacing, 100 height of bars same as spacing, 200 = no bars at all)
Show Text On/Off – showing text/contents from field in “Details”
Font Family – font type
Font Size – height of text
Font Style – regular/bold/italics/bold italics
Text Color – text color for text
On Text Overflow – specify action when text is longer than width of bar (“Do nothing” – text can be longer than width of bar; “Wrap text” – text will be wrapped to fit the width of bar; “Hide text” – no text in bar will be displayed)
Show Tooltip in Text – showing text/contents from field in “Description” under the text/contents from “Details”
Tooltip Font Size – height of text (for “Description”)
Tooltip Text Color – text color for tooltip
Color by – specify which criteria will be used to color bars (“Categories” – bars will have colors for each distinct entry in “Category” field, see section “Category colors” ; “Ranges” – bars’ colors can be specified based on defined range from field “Value”, see section “Bar color ranges”; “Groups” – bars in same color for each group, see section “Group colors”)
Milestones
You can specify milestones in the field “Details” and field “Type” = Milestone. RoadMap can show milestones with these formatting options
Show Milestones On/Off – showing milestones
Font Family – font type
Font Size – height of milestone text
Font Style – regular/bold/italics/bold italics
Show Date in Text – where to show contents of “StartDate” filed with milestone (“No” – no date info within milestones; “Right of text” – show date on the right hand side of text; “Below text” – 2 rows with text and date)
Date Format – picking up in standard format M – month, D – day, Y – year
Guidelines when Milestones only – when only Milestones shown, horizontal guidelines will shown for each row
For each milestone as specified in field “Category” (3 categories for milestones available):
“Your milestone category” shape – specification of shape for milestone for given category (“Diamond”; ”Triangle”; ”Circle”; “Square”)
“Your milestone category” color – color picker
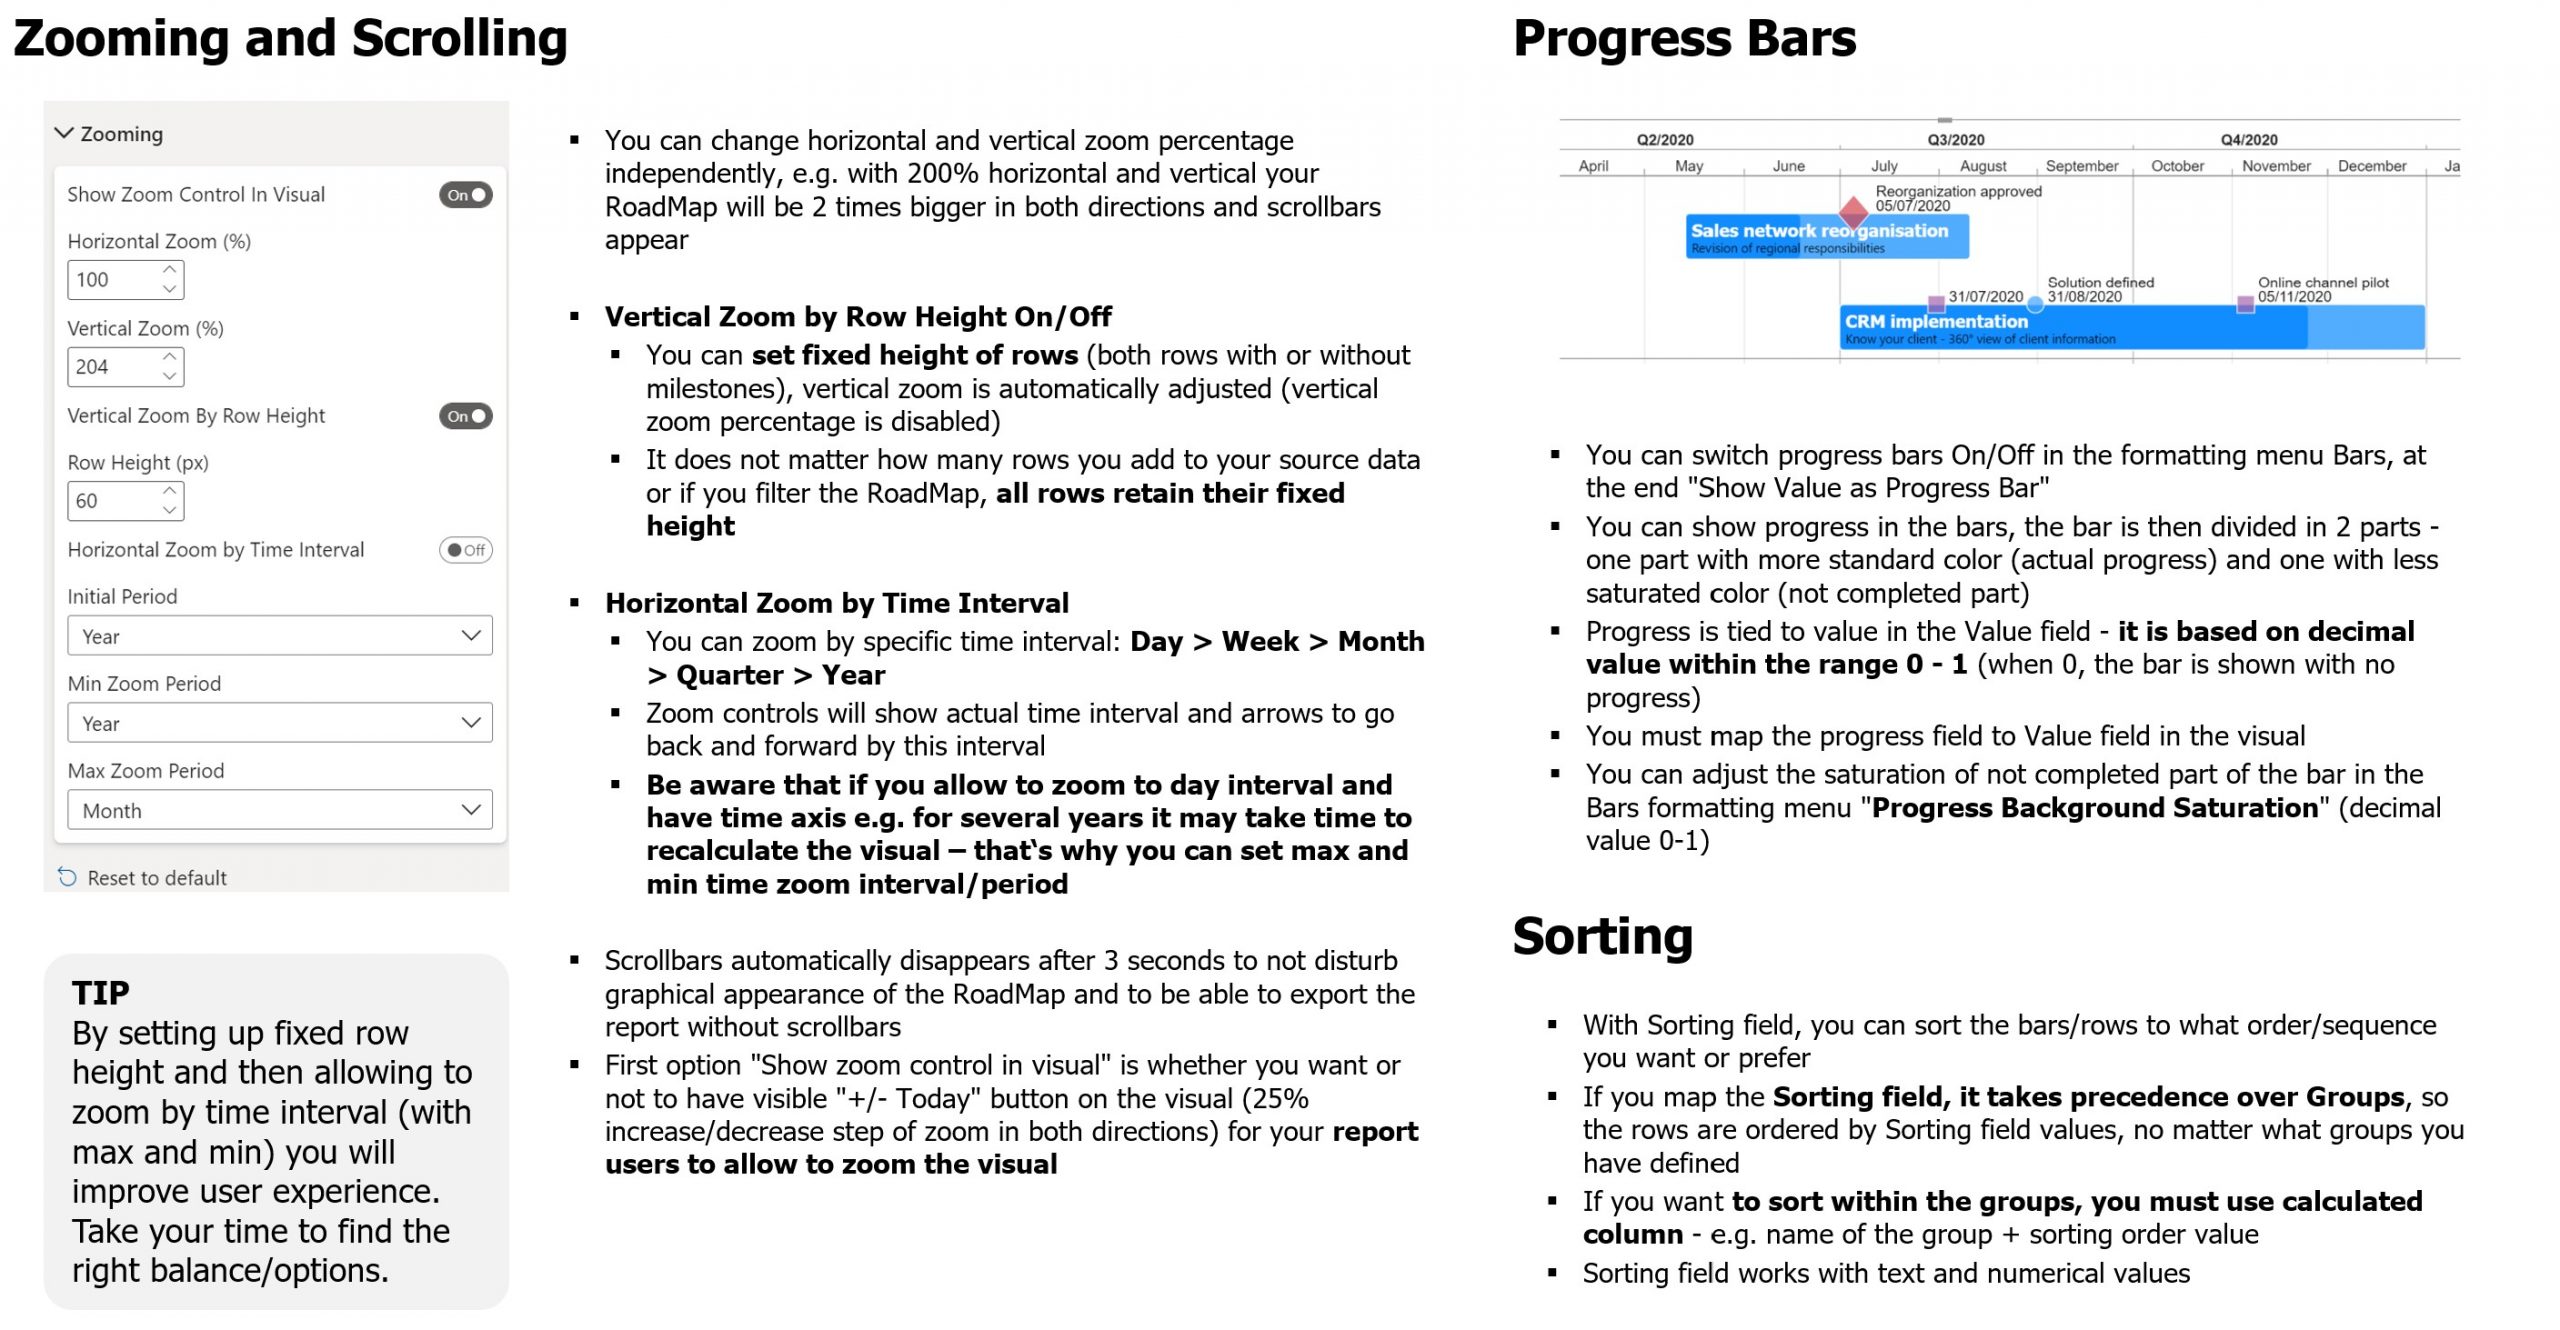
Color by ranges On/Off – milestones can be colored based on contents of filed “Value”, see section “Milestone color ranges”
Left axis
Left axis showing contents of the field “Y axis” to name rows of RoadMap. Furthermore these rows can be organized in groups as specified in the field “Groups”
Axis Width – in pixels, you can specify higher width to accommodate longer texts
Font Family – font type
Font Size – height of text
Font Style – regular/bold/italics/bold italics
Show Groups & Gridlines On/Off – showing groups labels and border gridlines
Group Font Family – font type for group
Group Font Size – height of text for group
Group Font Style – regular/bold/italics/bold italics for group labels
Grid for Group Labels On/Off – turn on/off gridlines for group labels
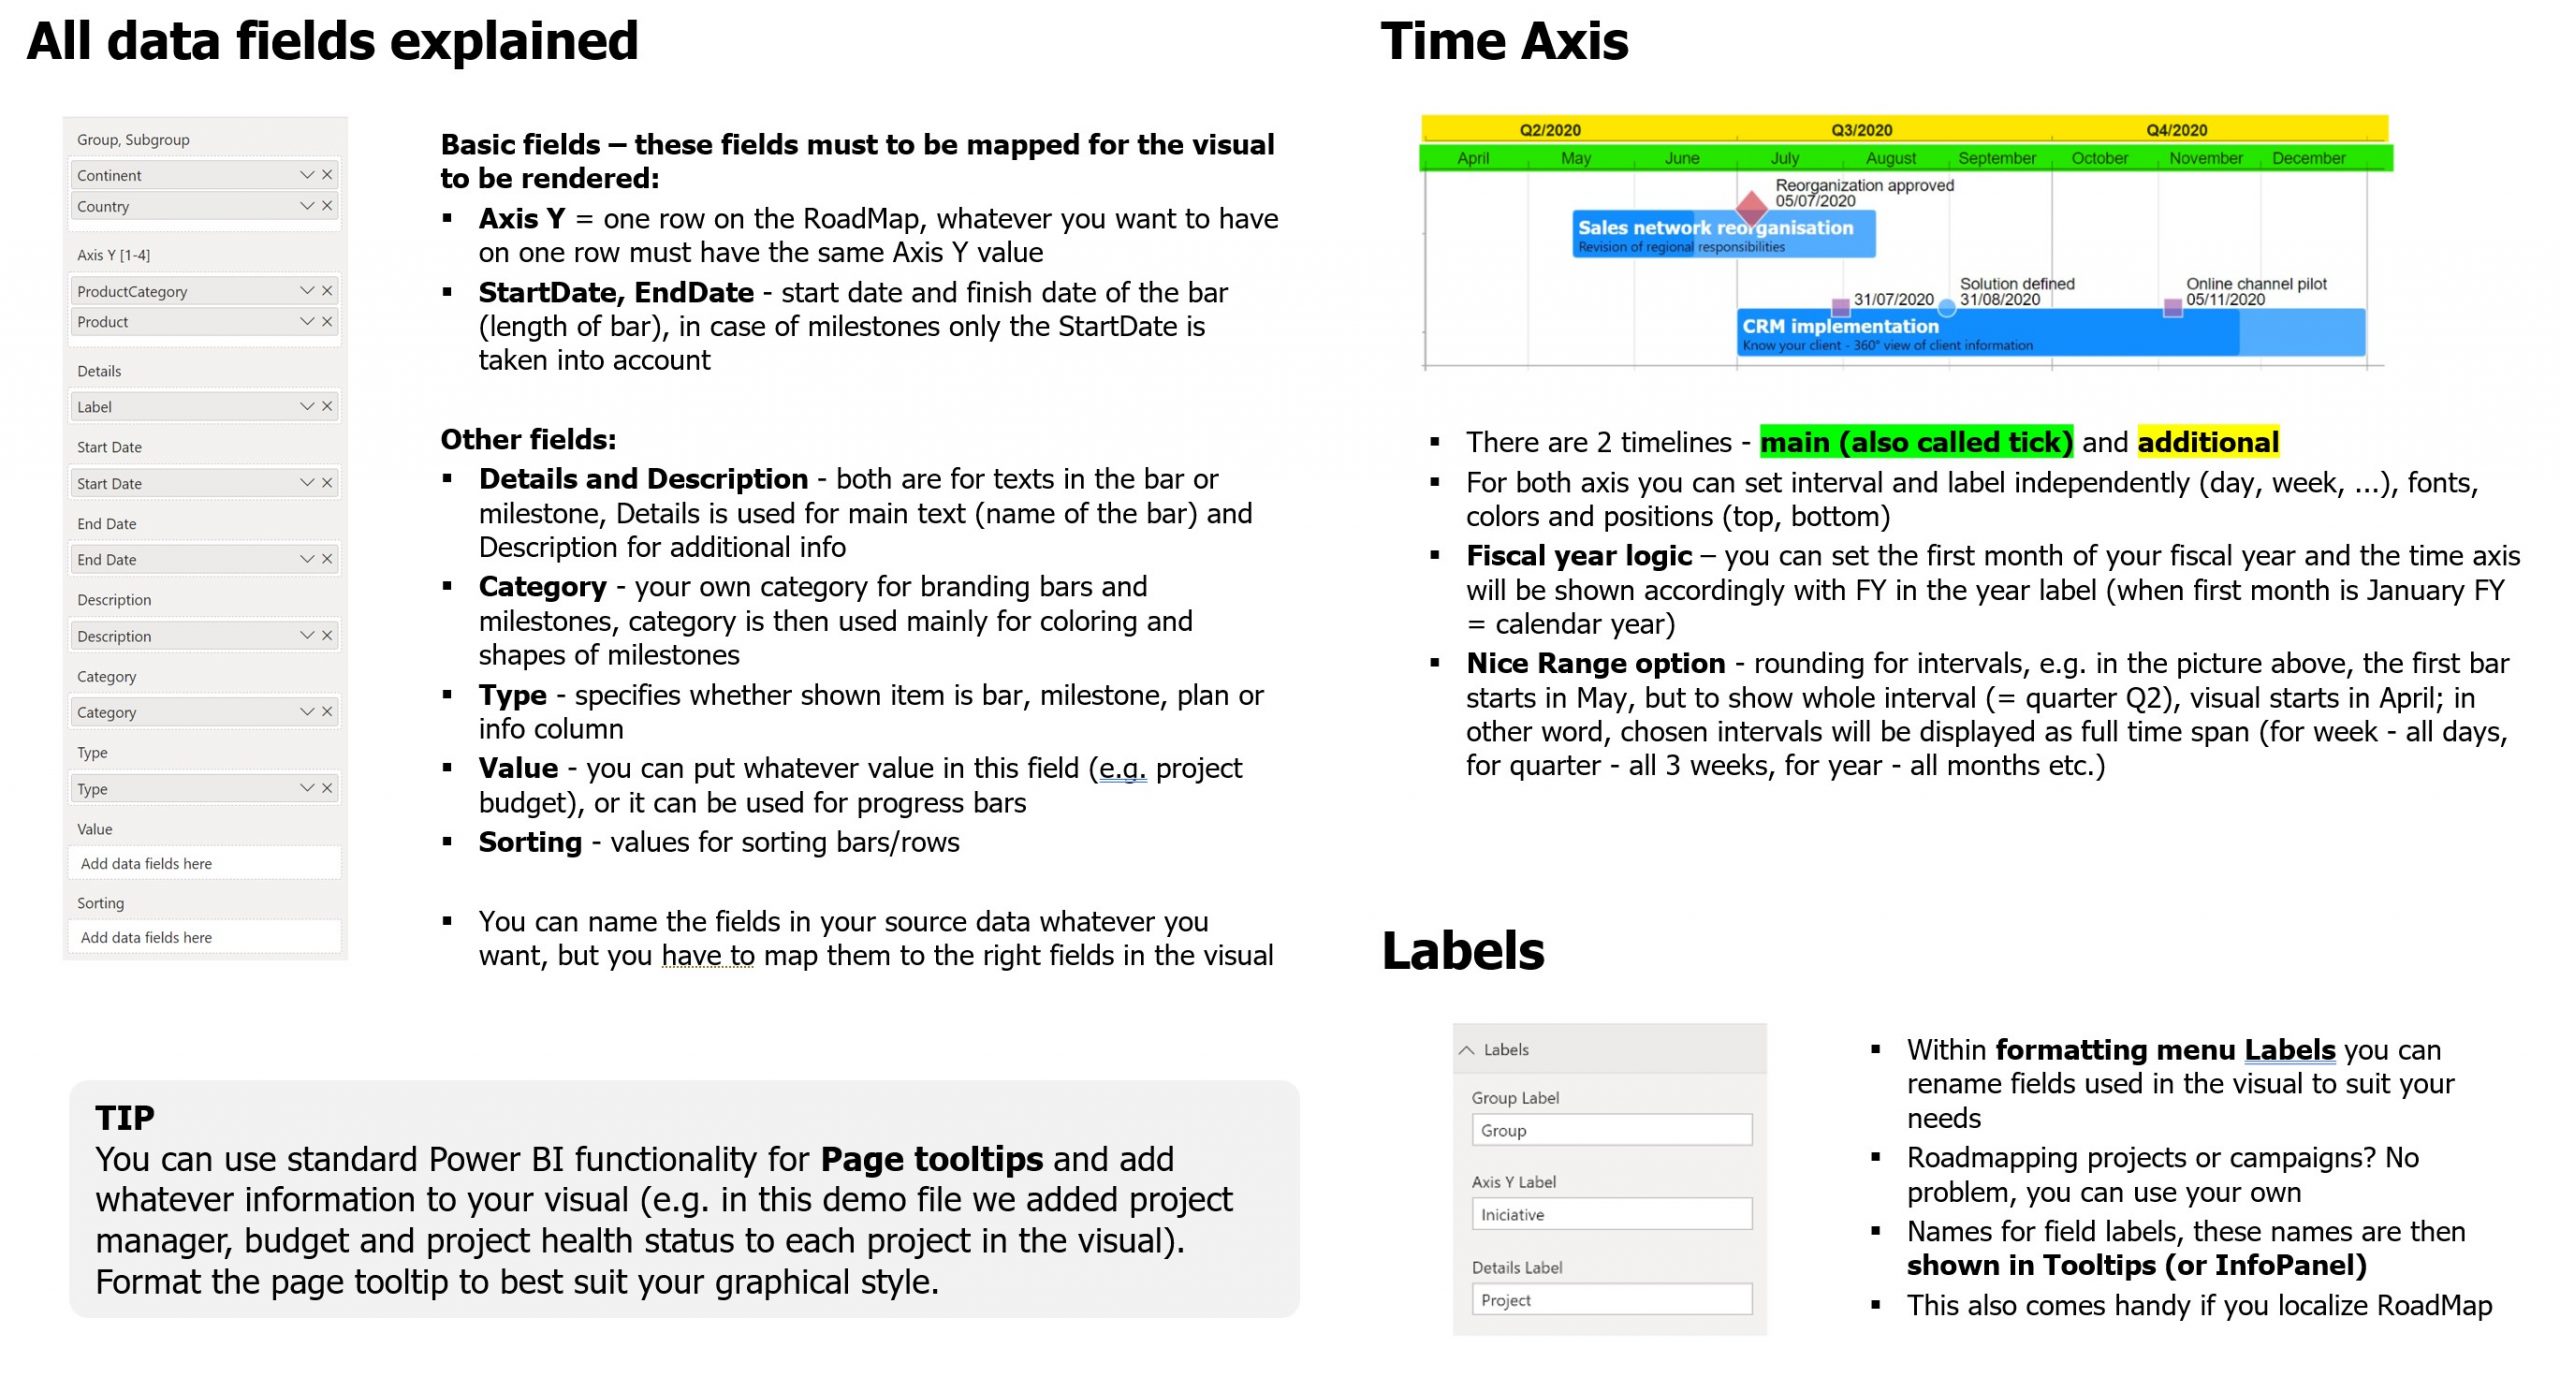
Time Axis
Shows essential time information for RoadMap. Main time scale is called the “Ticking” scale. Secondary scale – to show additional time context – is called the „Additional“. Tick is a marker of the beginning/end of the interval in the “Ticking” scale. Main scale is the one that is always drawn closer to the axis line when both scales are shown in the same position (either both on top, or both on bottom). These scale characteristics are configurable:
Position – identify vertical placement of both scales (“Both on top” – tick and additional on top; “Both on bottom” – tick and additional on bottom; “Bottom (tick) and top” – tick on bottom and additional on top; “Top (tick) and bottom” – tick on top and additional on bottom)
Ticking Label – what will be shown on tick scale (= unit used for labeling ticks)
Ticking Interval – time interval to be repeated on the ticking scale (start of a new interval draws a tick) – how long will be intervals between ticks (from minimum “Day” to “Year”; “Auto” – auto adjustments according to soonest StartDate and latest EndDate)
Tick Label Position – tick label will be shown either on tick mark or between gridlines (“On the line”; ”Between lines”)
Tick Font Family – font type for tick label
Tick Font Size – height of text for tick label
Tick Font Style – regular/bold/italics/bold italics for tick label
Nice Range On/Off – scale will be rounded to whole intervals according to “Nice Range Interval”, see bellow
Nice Range Interval – nearest interval for rounding the start and end of the ticking scale, e.g. when nice range interval is quarter, scale will start at the beginig of the quarter nearest to the start of the chart items and will end on the end of the quarter nearest to the end of the chart items
Show Additional On/Off – additional time unit axis
Additional Label – what will be shown on additional scale (= unit used for labeling additional marks)
Additional Interval – time interval to be repeated on the additional scale – how long will be intervals on additional axis (from minimum “Day” to “Year”; “Auto” – auto adjustments according to soonest StartDate and latest EndDate)
Additional Label Position – additional label will be shown either on additional mark or between additional marks (“On the line”; ”Between lines”)
Additional Font Family – font type for additional label
Additional Font Size – height of text for additional label
Additional Font Style – regular/bold/italics/bold italics for additional label
Show Gridlines On/Off – gridlines will be shown according to “Tick interval” and “Additional interval” setting
Tooltip
Shows data from the field “Details” and “Description” bellow the RoadMap. This tooltip is shown only when element – either “Bar” or “Milestone” – is picked/clicked on.
Tooltip On/Off – tooltip area will be added bellow RoadMap
Tooltip Height – height in pixels of area on the bottom of RoadMap visual showing tooltips
Tooltip Font Family – font type
Tooltip Font Size – height of text
Tooltip Font Style – regular/bold/italics/bold italics
Group colors
Shows all distinct groups from “Group” field with selection of color. Maximum of 60 groups available.
“Your group” color – color picker in drop-down menu
Category colors
Shows all distinct categories from “Category” field with selection of color. Maximum of 30 categories available.
“Your category” color – color picker in drop-down menu
Milestone color ranges
This section specifies max of 5 ranges for coloring “Milestones”. Color range is based on content form the field “Value”.
Range 1-5 min – set value for minimum (>=)
Range 1-5 max – set value for maximum (<)
Range 1-5 color – color picker in drop-down menu
Bar color ranges
This section specifies max of 5 ranges for coloring “Bars”. Color range is based on content form the field “Value”.
Range 1-5 min – set value for minimum (>=)
Range 1-5 max – set value for maximum (<)
Range 1-5 color – color picker in drop-down menu
Out of Range color – color picker in drop-down menu for “Bar” which “Value” is not specified in any range above
Today line
Line will be shown for current date (with text if desired).
Show On/Off – visibility of today line
Color – color picker in drop-down menu
Style – identifies today line appearance (“Solid”; “Dotted”; “Dashed”)
Text – optional text for today line
Font Family – font type
Font Size – height of text
Font Style – regular/bold/italics/bold italics
Today Text Position – where today line text will be positioned (“Left”; ”Right”), text will be shown always on the top of today line
Target line
Line will be shown for specified date (with text if desired). Date for target line should be entered first to show target line. Text of the line is positioned automatically to not overlap with the text of the „Today“ line.
Show On/Off – visibility of target line
Date – on what date target line will be shown
Color – color picker in drop-down menu
Style – identifies target line appearance (“Solid”; “Dotted”; “Dashed”)
Text – optional text for target line
Font Family – font type
Font Size – height of text
Font Style – regular/bold/italics/bold italics
Other format settings
Standard as for other Power BI visuals (Title, Position, etc.)
Additional info
Basic information & pricing | FAQs | Business and License conditions | Privacy policy